Computing CO2 emissions from Location History
For more than 10 years, I have been recording my location with Google Location History. This is a personal choice, I like going back in time and do stats about places I’ve been.
Recently, I’ve been trying to keep a closer look at my impact on climate change, which is driven by greenhouse gas emissions, measured in “CO2 equivalent (CO2e)”. A portion of these greenhouse gas comme from transportation.
So I wondered: Can I use this recorded personal data to better understand my personal impact on climate change for transpiration related emissions? Yes and you can too. This is what I got:
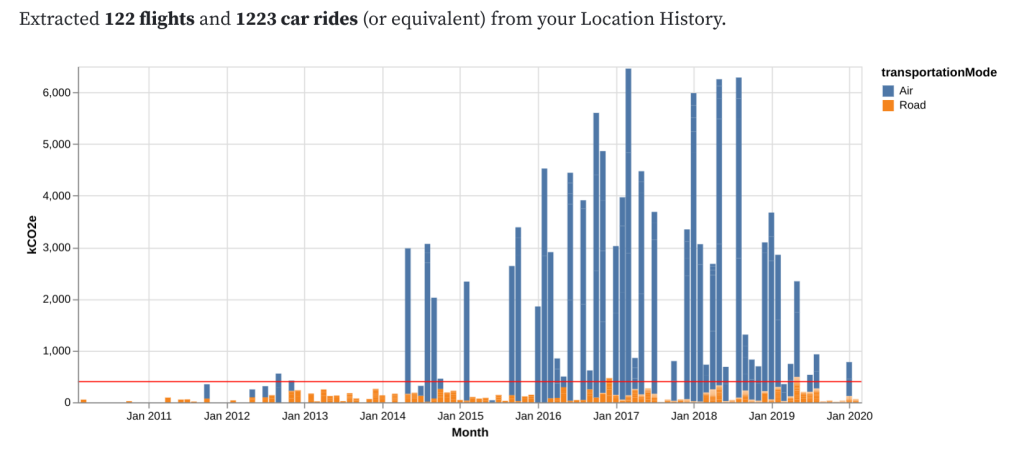
Technically, Location History does not have an API, but you can retrieve the data using Google Takeout. You get the raw data points, but also analysed activity segments, and a lot of them already are labeled (“flight”, “in vehicle”…). All I needed to do was to write a script that automatically unzips the archive and parses these JSON files. Then plot the results. I added an extra step of activity detection based on heuristics (e.g. long distance and high average speed means flights), as it seems my Location History data was not properly labeled before 2017.
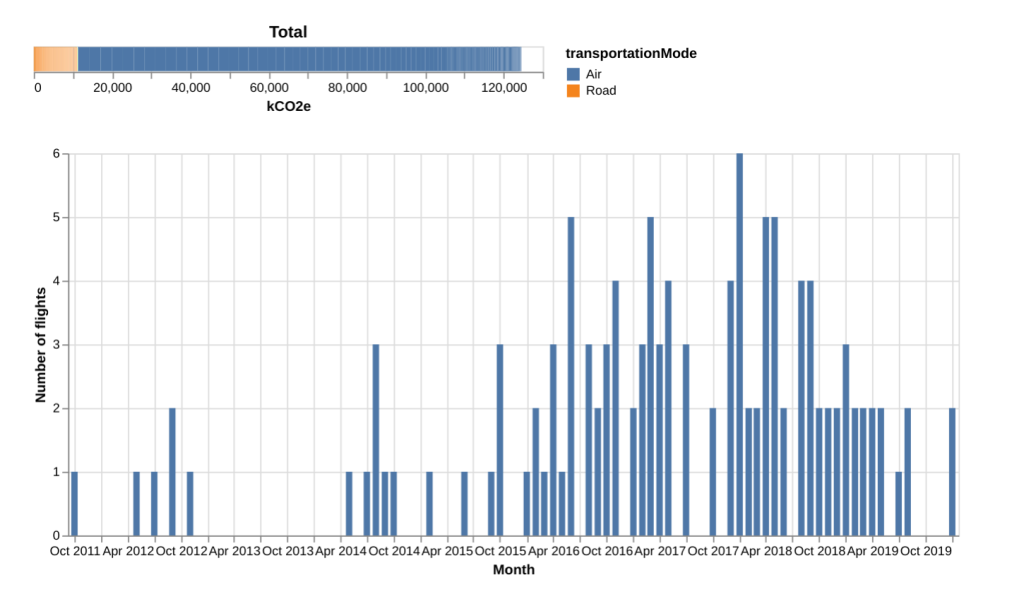
In my case: Most of my emissions are from flights. Most of my flights are for business, and I am lucky that my employer offsets them entirely. But I would prefer to not emit the CO2 in the first place, so will make an effort to fly less in the future.
If you also enabled Location History, you can get the charts for your data using this online web page. It does not store or upload your data. All computation is done client-side using JavaScript in your web browser.
Try it for yourself and see the code on Observable or on this export and repo.